
Estimating the water-cement ratio of hardened concrete
The other day, a client wanted to know the water-cement ratio of the concrete I was examining for him and I showed him how I estimated it. Then I thought maybe this subject could be of interest to quite a few people, so here's how I do it. (Text adapted from my book: "Scanning Electron Microscopy of Cement and Concrete".
The method depends on having a series of mature cement pastes for comparison made using different water-cement ratios, covering the range likely to be encountered in concrete. They should be at least a month old and preferably six months or older so that cement hydration is virtually as complete as it is ever likely to be, assuming that the concretes to be tested are mature. The pastes are examined in polished section in the scanning electron microscope (SEM) and images retained for comparison.
For simplicity, the reference materials shown here were all made using Portland cement; if slag or flyash or other cementitious materials were present, the reference pastes would have to reflect this. In the old days, when concrete just contained Portland cement as the cementitious material, things were much more straightforward than they are now. For PC-only mixes, just four pastes will suffice for most purposes: 0.3, 0.4, 0.5, 0.6. You could have smaller w/c intervals and maybe go to a higher w/c, say: 0.30, 0.35, 0.40, 0.45, 0.50, 0.55, 0.60, 0.65, 0.70; that still only makes nine reference mixes.
These days, considering a PC/slag mix, in order to have reference pastes at 80/20, 70/30, 60/40, 50/50, 40/60, 30/70 and 20/80 with just four different w/c ratios for each, say 0.3, 0.4, 0.5, 0.6, that makes 28 mixes. And then there's PC/flyash mixes, and PC/microsilica...
As this method compares pastes with the paste fraction of concrete, it estimates the effective water-cement ratio without any allowance for the water demand of the aggregate.
Having produced the reference images of the pastes, applying the method is easy; you just examine the concrete to be tested in polished section in the SEM and compare the paste microstructure with the microstructure in the reference images. Essentially, we are looking at the proportion of residual unhydrated cement grains and the porosity of the paste. At the water-cement ratio increases, the paste becomes more porous and more of the cement will have hydrated.
(Strictly, the fineness of the cement should also be taken into account but that would mean another variable; with composite cements, the number of test mixes required would run into hundreds. Life is too short for that - if I need test mixes for a particular purpose, I'll make some when the occasion arises - and hope the client can wait a while for them to cure.)
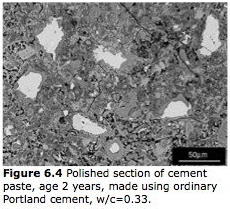
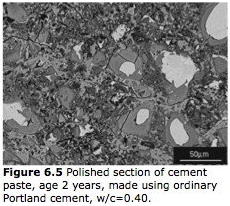
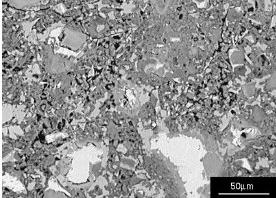
So, looking at Figures 1-4, we have four different pastes, each made using a different water-cement ratio. We have 0.33 as the lowest w/c ratio, as that was the lowest at which I could make a paste of that cement without using any admixture, which I didn't want to do. A clear progression is apparent, with fewer grains of unhydrated cement and more pores visible at higher w/c ratios.
 |
 |
 |
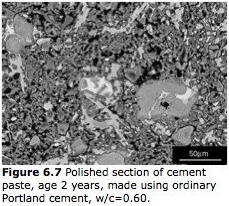 |
(The above images are from the Understanding Cement book, so ignore the Figure numbers)
Looking at these four images, it is easy to see why concretes made using lower water-cement ratios are more durable, being both stronger and less permeable.
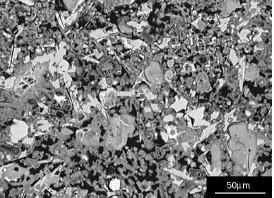
Now you have a go with the following two SEM images; they are both pastes, not concretes, so there's no aggregate to get in the way!
 |
 |
The two "unknowns" were taken at the same magnification as the reference images; they are shown slightly larger here but that shouldn't hinder comparisons unduly. Look at the porosities and residual cement and decide which of the four reference images they most closely resemble. If you want, you can interpolate between the reference images; if you think one of the unknowns is of w/c ratio between 0.4 and 0.5, but nearer 0.4, for example, you can guesstimate a w/c ratio of 0.44, or whatever. Answers at the bottom of the page...
More rigorous methods have been developed; a common one is to embed the sample in a resin containing a dye sensitive to ultraviolet light. You examine the specimen in a petrographic microscope under ultraviolet light and measure the emitted light intensity; the stronger the light, the higher the porosity and so the higher the w/c ratio. I have dabbled with developing SEM-based methods using either image analysis or X-ray microanalysis - both worked well in my limited tests but, for most purposes, the method shown here using reference images works well enough.
Indeed, if you did decide the images of the "unknowns" above were suggestive of a water-cement ratio intermediate between those of the reference images, you have discovered one of the main problems, which is that even a laboratory-prepared paste does not have a uniform w/c ratio when viewed microscopically. A typical piece of concrete will show even more variability.
I imagine that the main reasons for this are random distributions of water and cement that vary appreciably on a local scale, cement particle size (the finer the cement, the more uniform the paste), movement of aggregate within the paste during mixing, and gravity. Can anyone think of any others?
Answers: left image, w/c ratio is 0.6; right image, w/c ratio is 0.5. These images are different regions of the reference pastes - see the comment on variability above.
Exit water-cement ratio blog page and return to the main blog page
Check the Article Directory for more articles on this or related topics
Recent Articles
-
Zero carbon cement by electrochemical synthesis
 A pathway to zero carbon cement: Review, Ellis et al: Toward electrochemical synthesis of cement
 -
ASR Video 1
 An over-the-shoulder look at ASR in concrete as seen using the SEM.
 -
Book Review - Alkali-Aggregate Reaction in Concrete: A World Review
 The UC review of "Alkali-Aggregate Reaction in Concrete: A World Review" edited by Iam Sims and Alan Poole.


Almost everyone interested in cement is also concerned to at least some degree with concrete strength. This ebook describes ten cement-related characteristics of concrete that can potentially cause strengths to be lower than expected. Get the ebook FREE when you sign up to CEMBYTES, our Understanding Cement Newsletter - just click on the ebook image above.